Pipeline Health
Pipeline Health helps SDL users understand why a pipeline is healthy, degraded, or failing without direct access to Kubernetes or backend terminals. It combines current runtime state, generated diagnostics, events, and available logs into one troubleshooting workflow.
Diagnose a Pipeline
-
Open the pipeline management page.
-
Select Health from the upper-right pipeline toolbar when you want the current troubleshooting snapshot.
-
Read Summary first: a healthy pipeline shows a simple confirmation message, and a pipeline that needs attention shows the highest-priority affected pipeline or graph node.
-
Expand Data flows to inspect each pipeline branch and the graph nodes on that path.
-
Select a graph node entry in Data flows to open that node’s logs in the bottom Logs panel.
-
Expand Signals when you need the supporting diagnostic evidence.
-
Use Live logs for the current log stream from an underlying runtime resource, such as a pod.
-
Use Health logs for the scoped troubleshooting evidence collected by Pipeline Health. Health logs are not live.
-
Use data flow logs when you need the aggregated Health log evidence for one pipeline path.
-
Correct the configuration or dependency, restart the pipeline when needed, and select the circular Refresh button in the Health drawer to update the Health snapshot and verify the result.
Health is a point-in-time snapshot. Older evidence can remain visible after a restart so that you do not lose useful context, but stale evidence does not trigger new attention. If you change the pipeline, restart it, or fix an external dependency, refresh Health manually from the Health drawer before deciding whether the issue is resolved.
Pipeline Health uses fixed diagnostic rules. It does not use inference, and some runtime errors might not be identified until a rule exists for that condition. When an observed warning or error is not captured by Health, request an engineering update so the diagnostic rules can be expanded.
Read Severity
| Severity | Meaning |
|---|---|
Healthy |
Current evidence confirms that the pipeline or data flow is healthy. |
Warning or Degraded |
The pipeline can still provide useful evidence, but a problem needs attention. |
Error or Invalid |
A failure or invalid configuration is blocking the affected pipeline area. |
Partial, Unavailable, or Unknown evidence |
The backend could not collect enough current evidence to make a complete statement. This is not the same as healthy. |
Stale |
The evidence is from an earlier pipeline state. Use it for context, then refresh. |
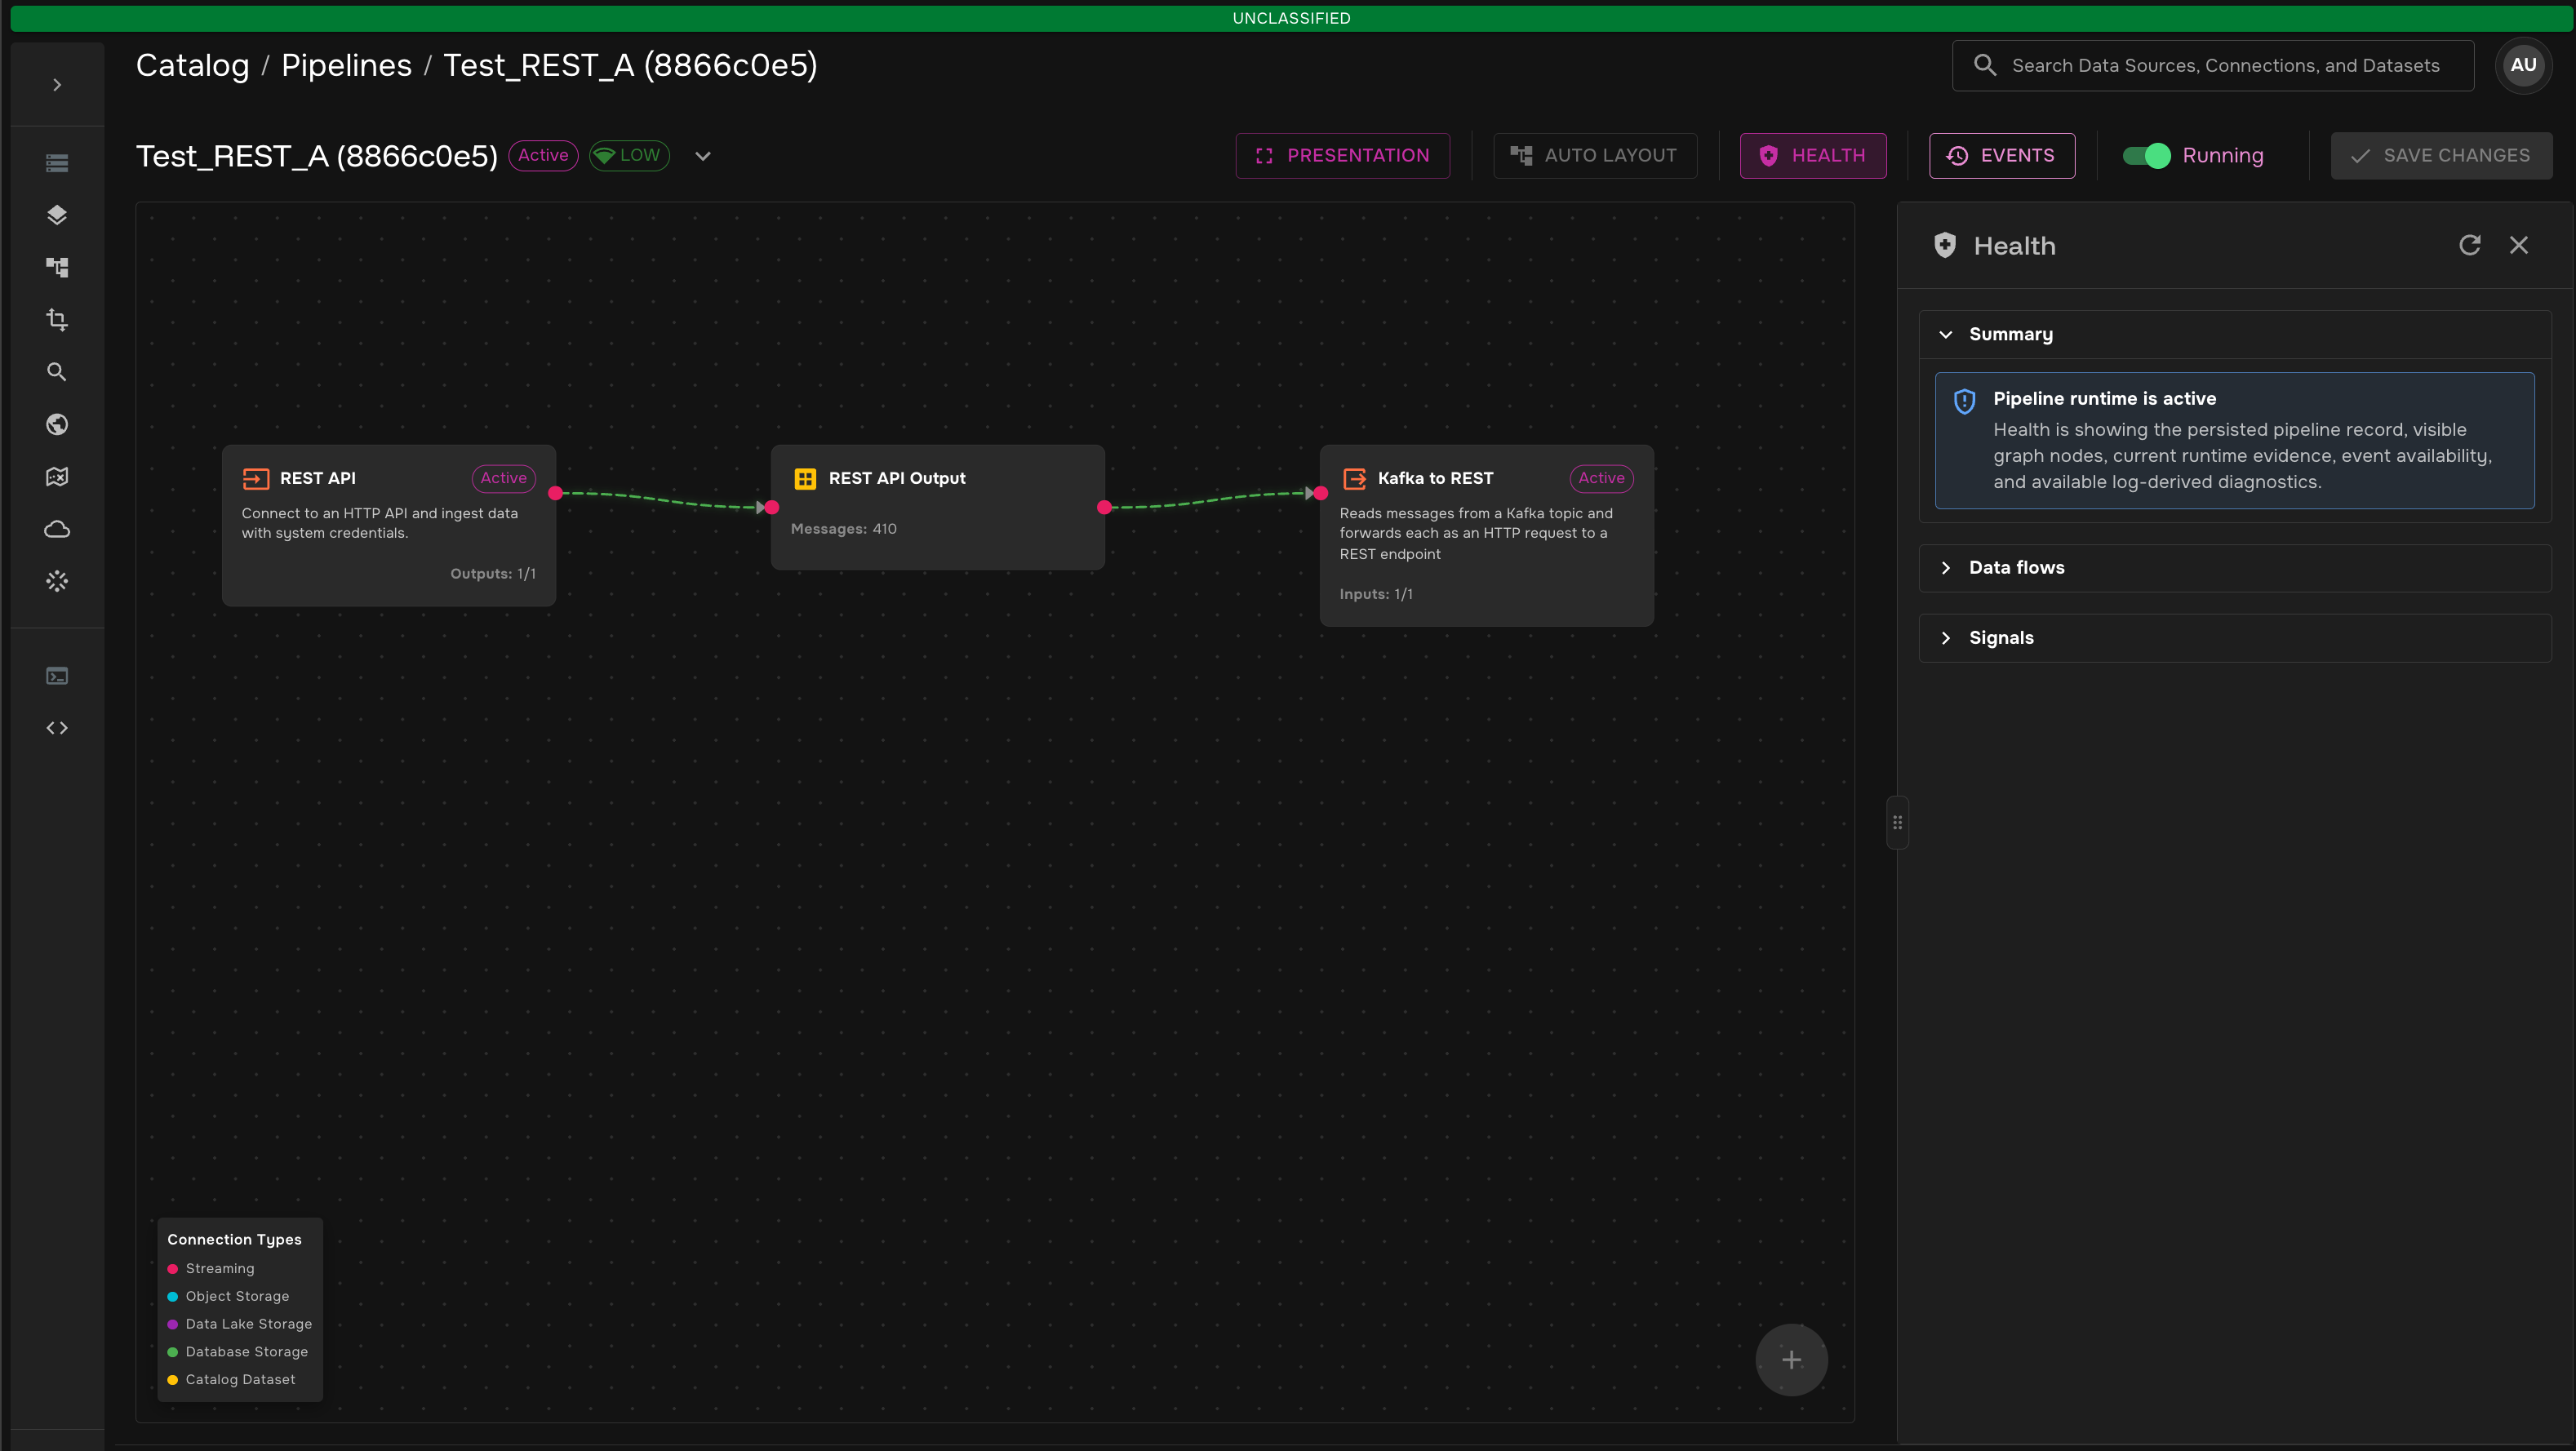
Confirm a Healthy Pipeline
When the current evidence does not show a problem, Summary confirms that the pipeline runtime is active. The Health panel can stay compact: Data flows and Signals are available for inspection, but they do not need to be opened for routine confirmation.
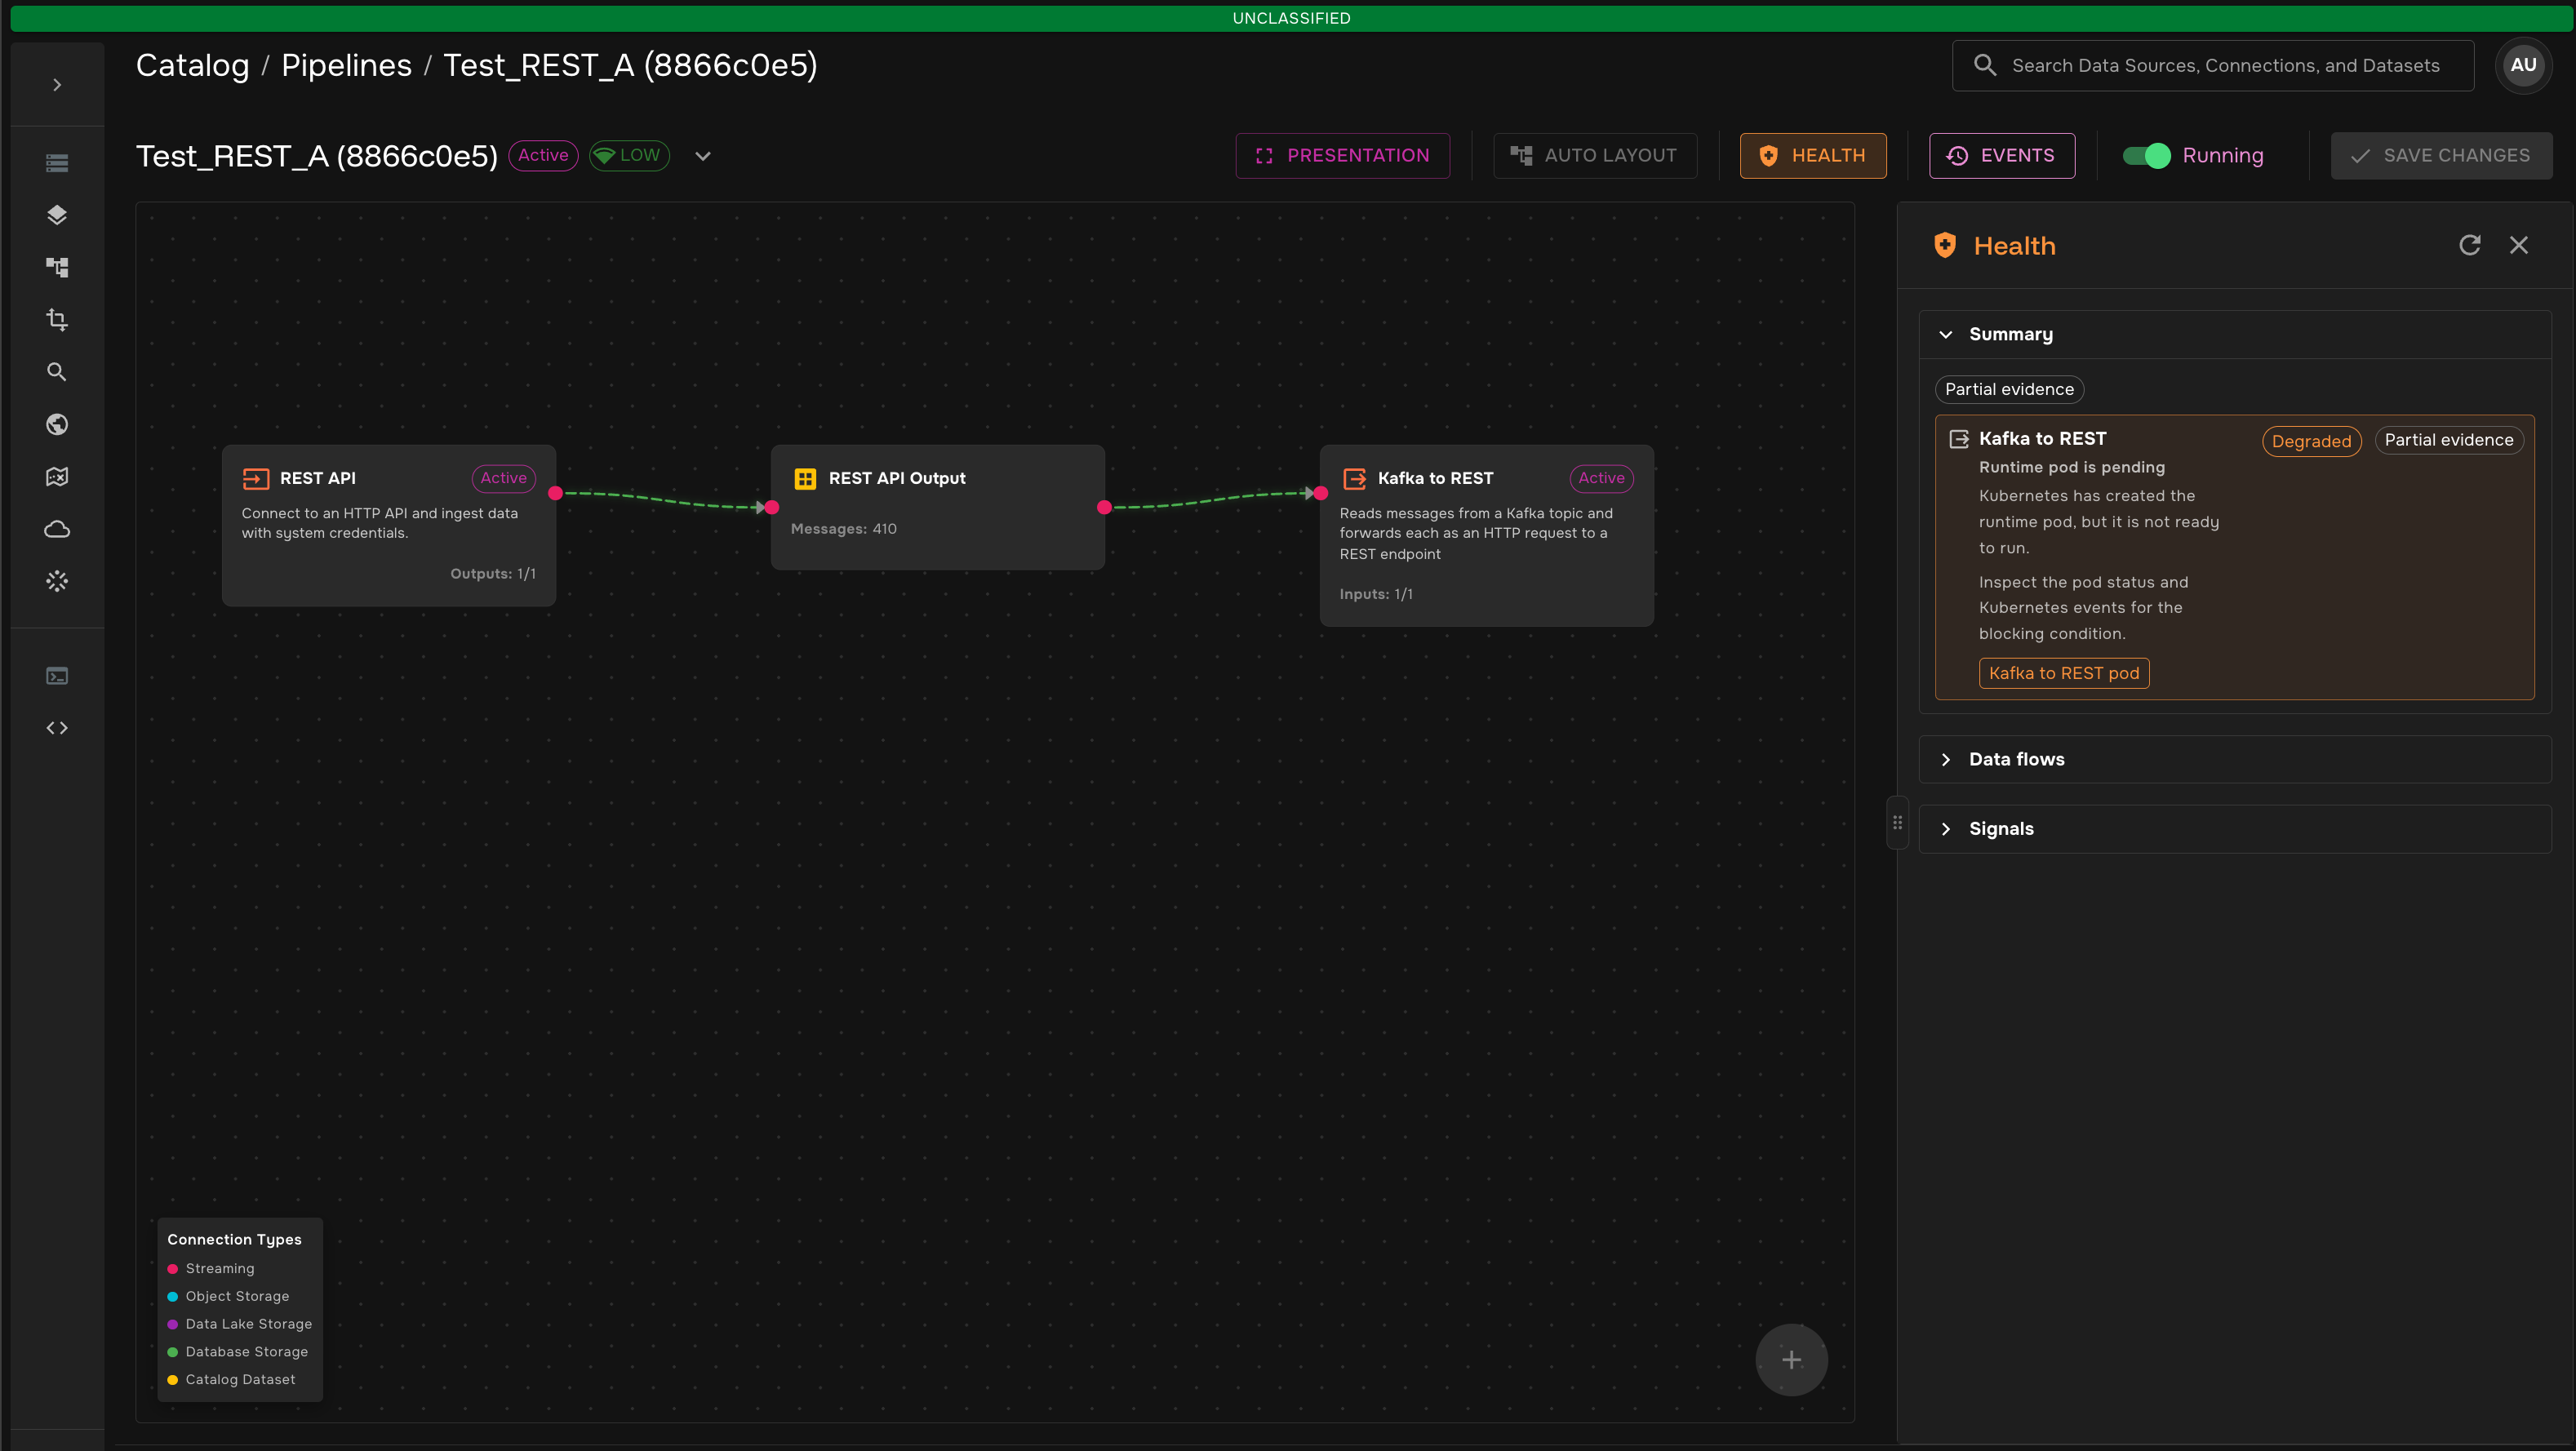
Investigate a Degraded Runtime
When runtime evidence is incomplete or a runtime resource is not ready, Health uses a degraded or warning color and summarizes the affected graph node. The Summary entry identifies the affected node, the observed condition, and the recommended next action. Resource chips identify the related runtime resource, such as the pod connected to that node.
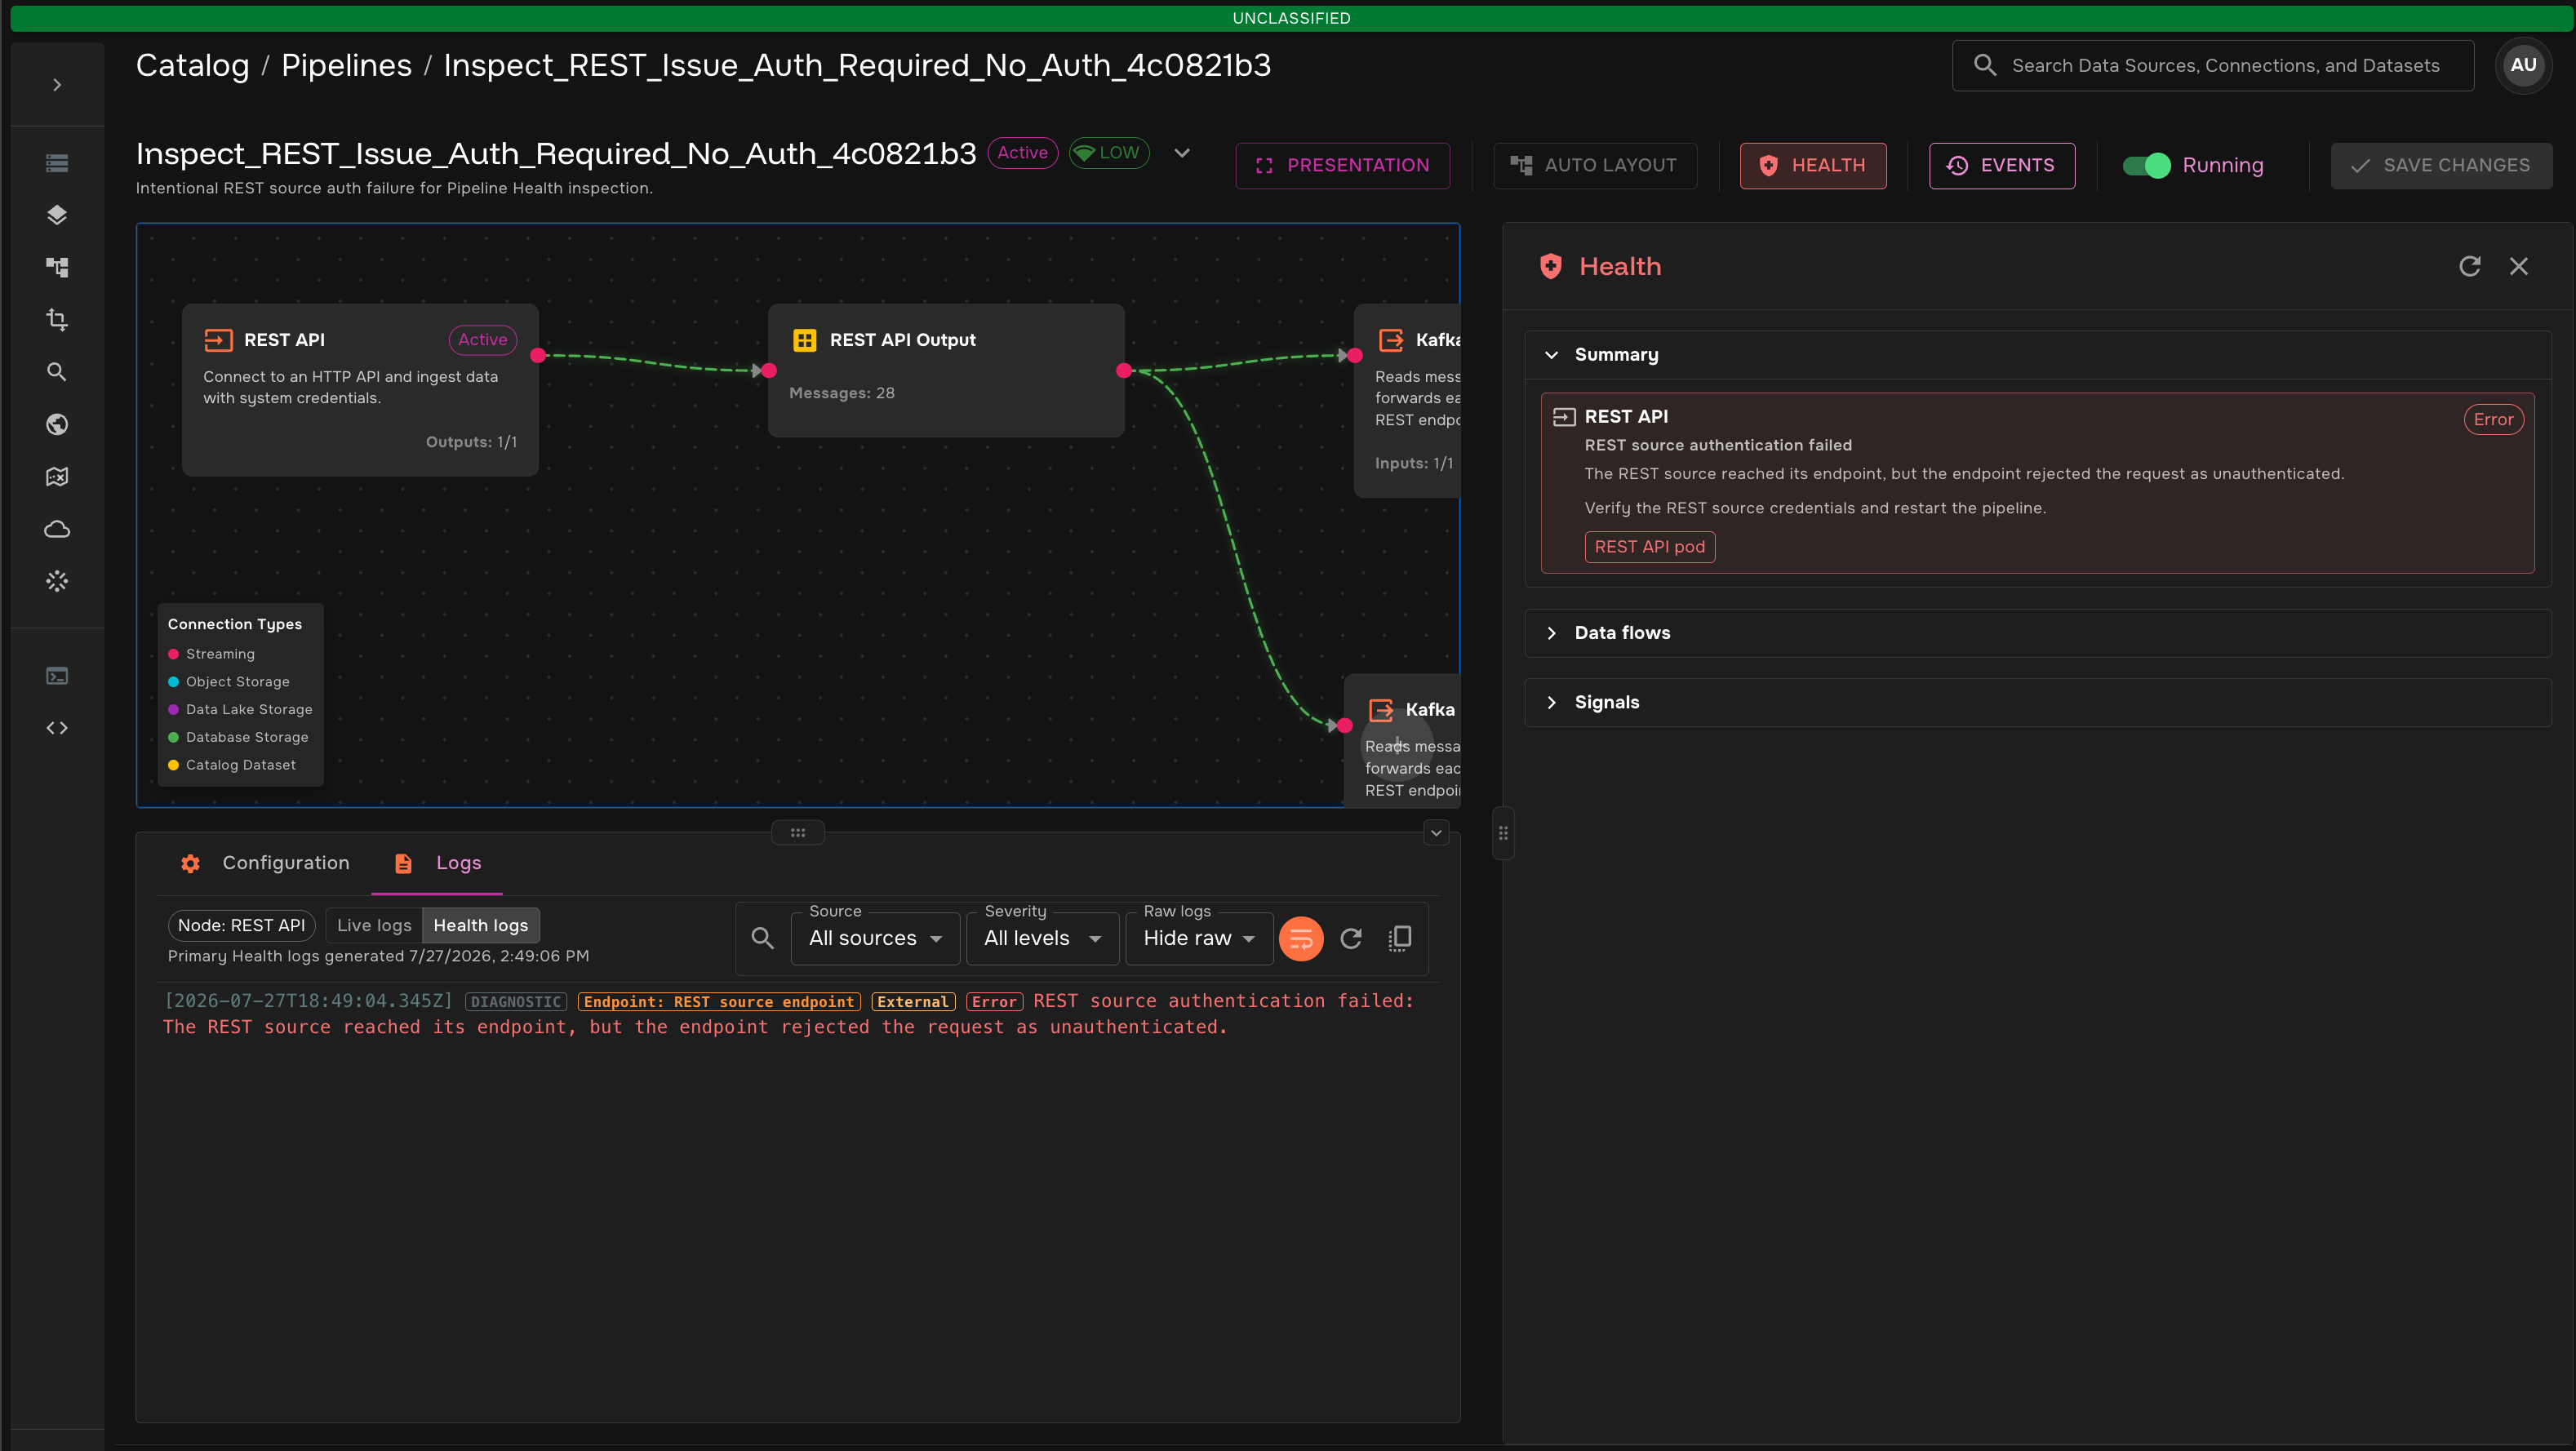
Diagnose a Blocking Source Failure
More severe failures are shown with the highest current severity color. For example, a REST authentication failure is surfaced in Summary as an affected source node, with the failed condition, explanation, recommended action, and related resource chip. Opening Health logs for that node shows the generated diagnostic evidence behind the finding.
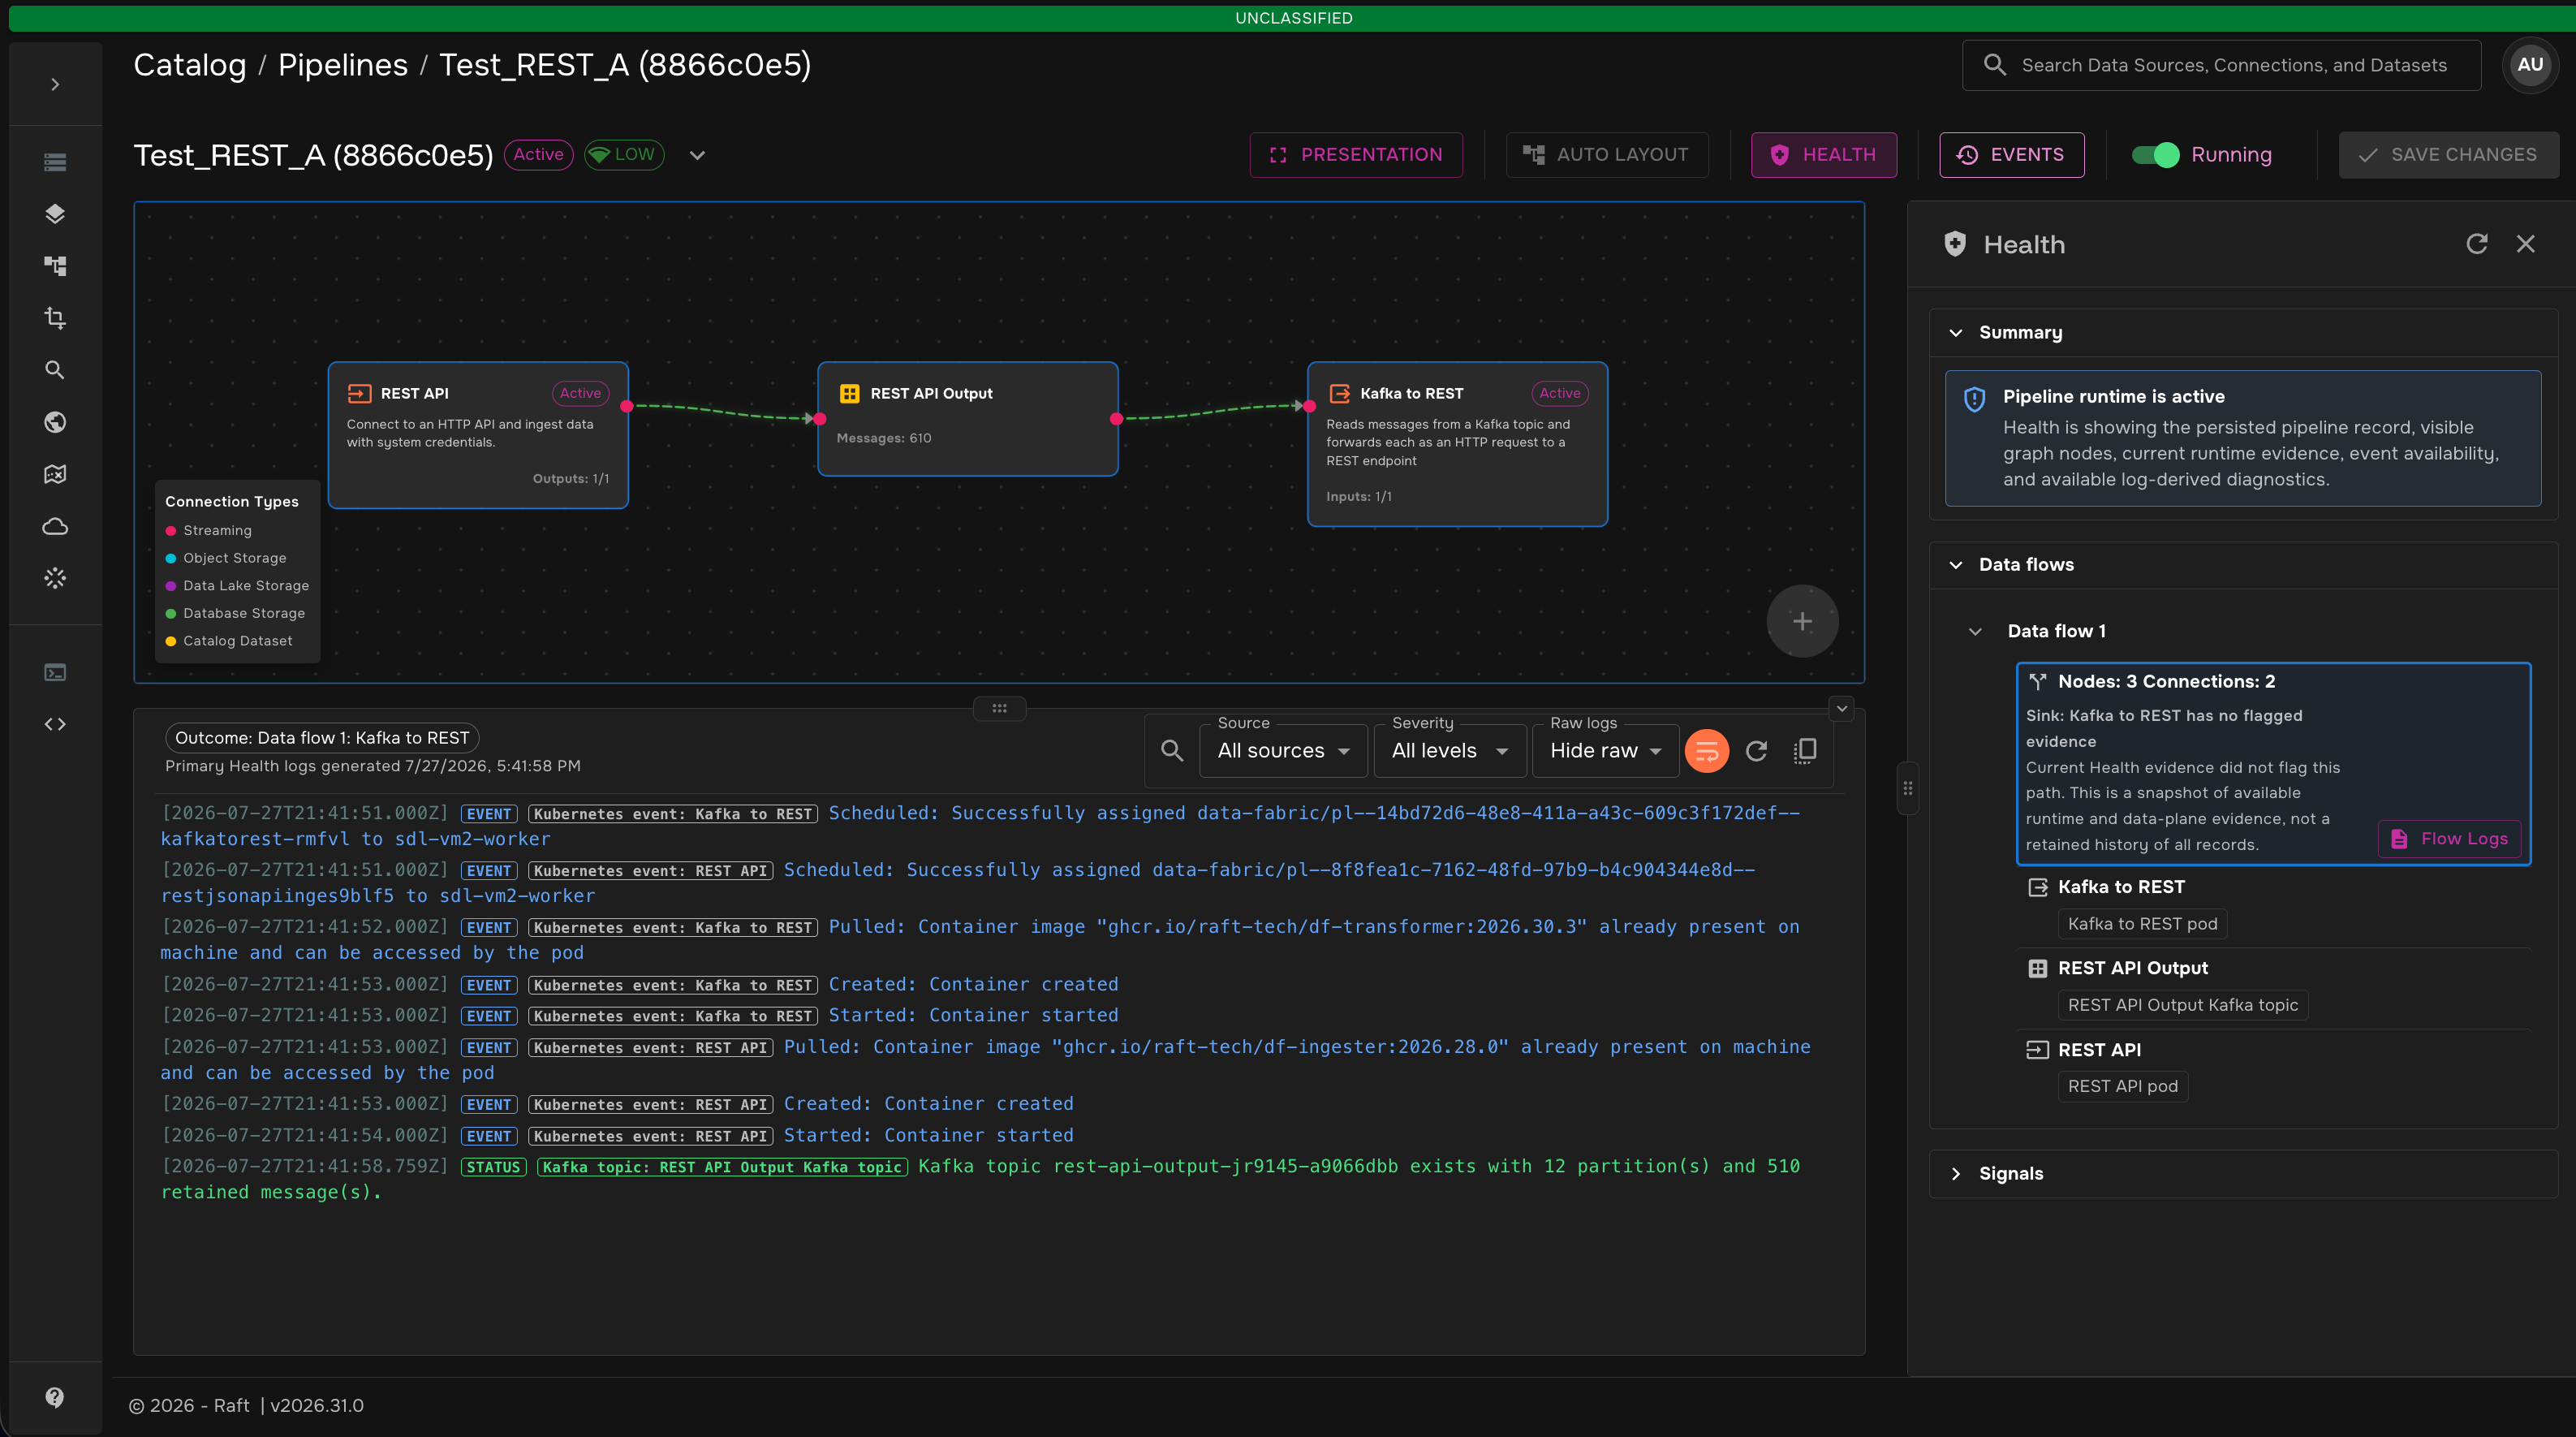
Drill Into Data Flow Logs
The bottom Logs panel can combine:
-
generated Health diagnostics;
-
Kubernetes and pipeline events;
-
pod and container status;
-
current runtime logs when they are readable.
Data flow logs are scoped to one pipeline path. They show the events, status entries, diagnostics, and readable logs that explain that path, not a retained history of every record that passed through the pipeline. The Health panel highlights the selected data flow while the bottom Logs panel shows the corresponding evidence. Selecting a graph node entry opens that node’s logs in the same bottom Logs panel.
Health log filters help narrow the evidence by source, severity, and whether raw supporting log entries are shown. Live logs remain available for the current transformer stream when a runtime log target supports them.
A Health logs action appears only when the backend advertises a valid target. The frontend does not guess targets. Useful diagnostics can therefore be available even when a runtime pod or raw log stream is unavailable; the Logs panel reports which evidence sources were available and why another source could not be read.
| Start with Summary. Use Data flows and Health logs when you need the evidence behind that diagnosis. |
For architecture and extension guidance, see the Pipeline Health Developer Guide.